Anteeksi...

Sivua ei ole saatavilla suomeksi

Pysy sivulla | Siirry aiheeseen liittyvälle suomenkieliselle sivulle

04-05-2020 14:21

Do green bonds outperform in ‘risk-off’ periods? Yes, but beware the nuances

We find that green bonds have been more resilient than traditional bonds in times of crisis, but there are things to keep in mind when doing the analysis.
Windmills and green field

Financial crises and economic downturns provide an opportunity to analyse the behaviour of investors and financial instruments to understand which assets are resilient and which are not. With the current crisis in mind, we ask: How have green bonds fared now and in previous times with elevated risk aversion, so-called “risk-off” periods? Have green bonds outperformed the traditional bond market?

After a comparative analysis, we find that green bonds have fared better than traditional bonds in the current crisis as well as past major risk-off periods, but there are nuances to keep in mind when making the assessment.

Understanding green bond performance

The green bond market is relatively young, having developed rapidly in recent years, which makes a straightforward comparative analysis of green and non-green indices inaccurate and potentially misleading. We propose dividing the green bond market’s development into four distinct phases (see the chart below) to outline how the nature of the market has changed. It is important to be mindful about these different phases and their inherent characteristics when assessing the comparative performance of green bonds.

To illustrate the market’s evolution, the number of constituents in the ICE BofA Green Bond Index serves as a proxy for the number of green bonds issued, and the suitability of an indices-based comparison.

Figure 1: The four phases of the green bond market's development

Green spread – Non Green spread (lhs) compares the option-adjusted spreads (OAS) of ICE BofA Green Bond Index and a synthetic index. The synthetic index consists of non-Green indices weighted by the percentage full market value shares of sectors included

Phase 1: Birth of the green bond market

In this phase, issuance of green bonds is sporadic, the rarity value of green bonds is high, and the supply solely originates from low-risk SSAs (sovereigns, supranationals and agencies). Green and non-green bonds are not comparable, ruling out an index-based analysis.

Phase 2: Initial stabilisation

The rarity value of green bonds remains high, and spreads are skewed towards lower-risk issuers due to of the predominance of the strongest AAA issuers, making it infeasible to compare green bond spreads against an index. Corporates and FIGs (financial institutions groups) are entering the market, but SSAs are still dominating.

Phase 3: Growth phase

The issuance of green bonds grows rapidly, and the composition of issuing entities shifts from being predominantly very low risk to having an increased share of FIG and corporate issuers. This inflates the green bond index spread, and non-green bonds are perceived to perform better during this period, when comparing the spreads of green and non-green indices.

Phase 4: From ‘niche’ to global

The number and diversity of green bonds have reached levels that make the behaviour of green and non-green bonds similar. The rarity value is lower, as is the structural supply/demand imbalance that has historically driven spread differentials between green and non-green. Green bond indices can be compared to non-green bond indices.

Green bonds do outperform in the secondary market during risk-off periods

The current crisis is an apparent risk-off period, giving us an opportunity to analyse the behaviour of green versus non-green bonds. As outlined above, an analysis of large passive indices is suitable for this crisis, due to the maturity of the green bond market.

We compare the ICE BofA Green Bond Index to a synthetic non-green index (see footnote to Figure 1 for clarification). As a gauge for risk-off sentiment during this period, we include the iTraxx Main index, a basket of credit default swaps of 125 European investment grade issuers, for reference. During the corona crisis, the value of the iTraxx index peaked at close to 140bps between February and mid-March, compared to a value of around 40bps prior to the crisis.

As shown below, there is a sharp dip in the difference between green and non-green spreads as the risk sentiment spikes, indicating a relative outperformance of green bonds during the initial weeks of the crisis. Compared to the initial levels before the onset of the crisis, the relative outperformance was about 35bps at the peak.

Figure 2: Green bond performance during the COVID-19 risk-off period

Figure 2. Green spread – Non Green spread (lhs) compares the option-adjusted spreads (OAS) of ICE BofA Green Bond Index and a synthetic index. The synthetic index consists of non-Green indices weighted by the percentage full market value shares of sectors included in the ICE BofA Green Bond Index, rebalanced on a monthly basis. iTraxx main (rhs).

We find further support for green bond outperformance when analysing the previous significant risk-off period, Q1 2016. The risk drivers for that period were a combination of diverse factors, including the Crimean crisis, a significant drop in oil prices and a Chinese stock market crash. This was the last time before the current crisis that iTraxx Main has crossed +100bps. However, a comparison of green and non-green, based on indices, is not feasible, as illustrated by the outline of the different phases of the green bond market (see above).

An alternative approach for analysing price differences in this period is to compare green and traditional bonds issued by the same entity. Composing a selective peer-based index of EUR corporate green and non-green bonds with a similar sector, rating and tenor, allows for a fairer price comparison. This analysis shows that green bonds outperformed non-green bonds, on a relative basis, during the risk-off period Q1 2016, by about 15bps.

Figure 3: Green bond performance during the Q1 2016 risk-off market

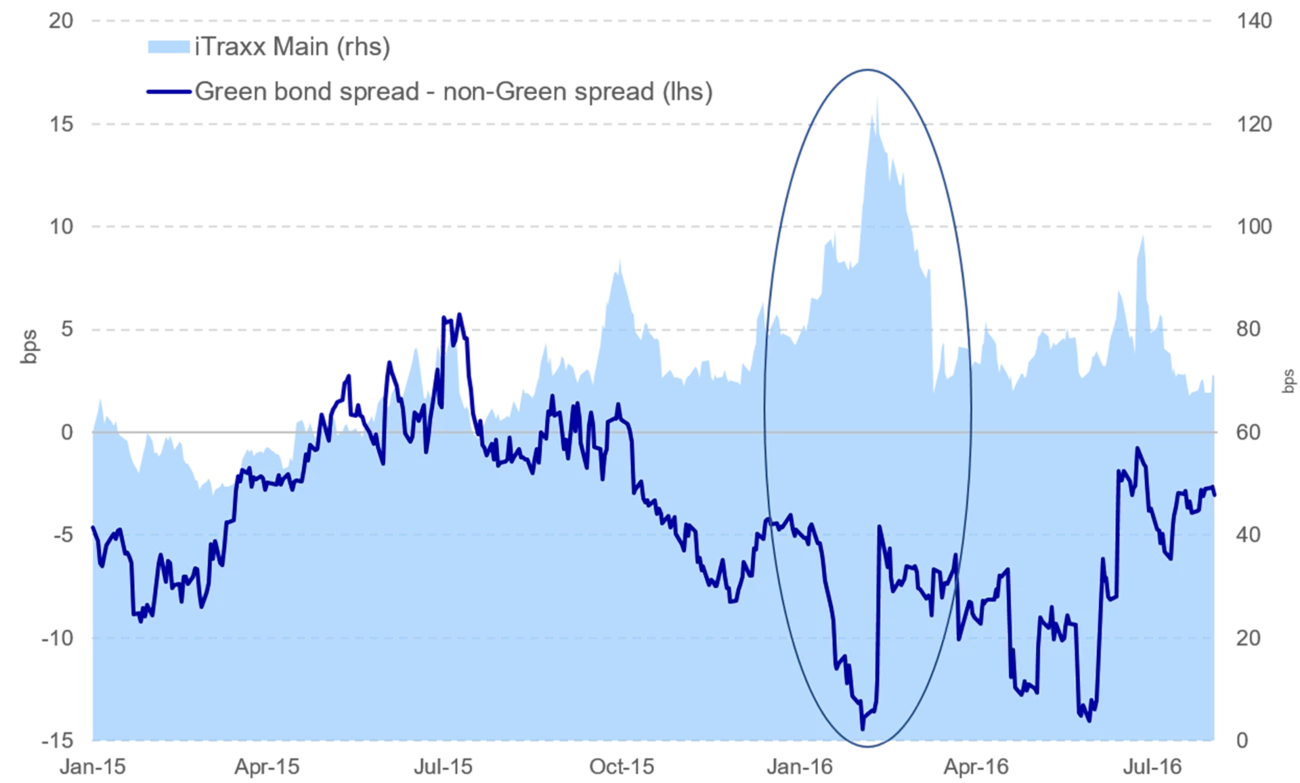
Figure 3. Green spread – Non Green spread (lhs) compares spreads of EUR benchmark green bonds and vanilla bonds from the same entities with similar tenor, sector and rating. iTraxx main (rhs).

Reasons for green bond outperformance in risk-off periods

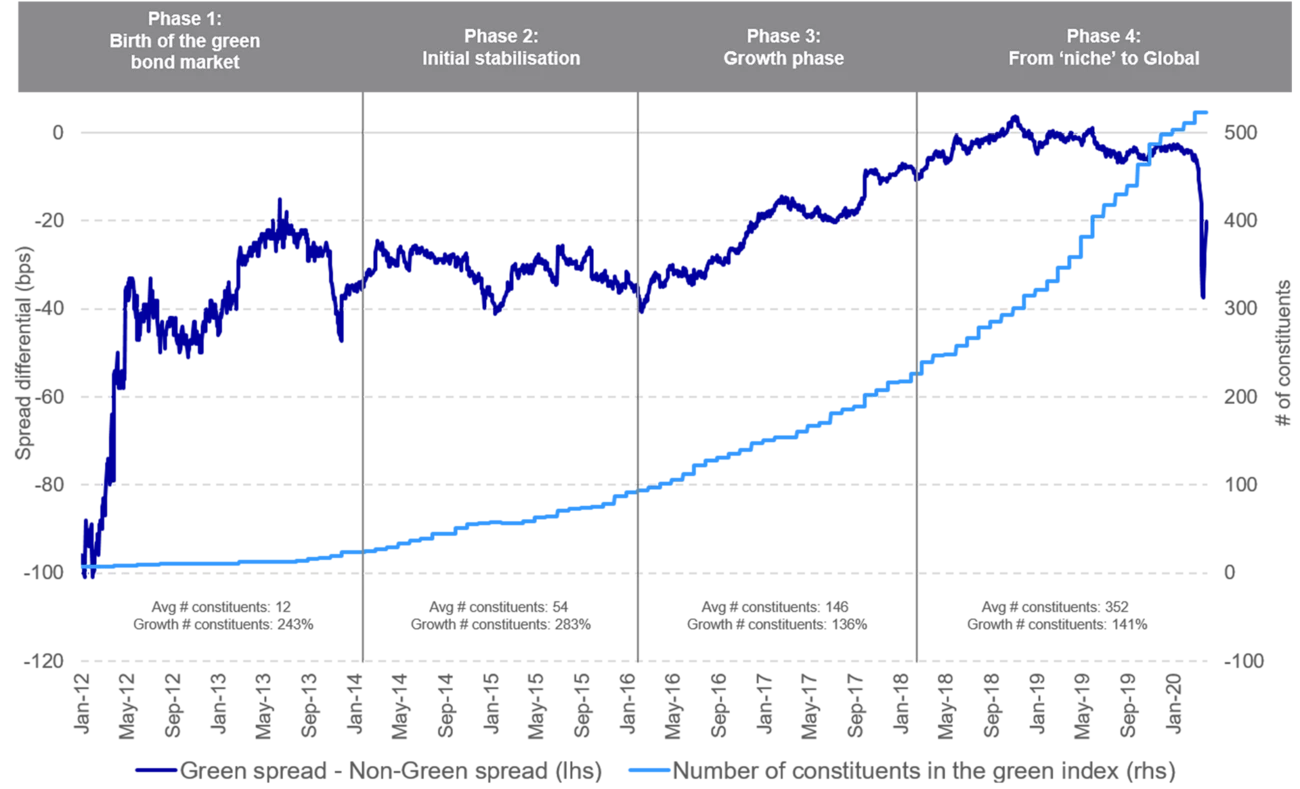
As indicated in the secondary spread analysis in Figure 1, green bonds do not currently seem to price tighter than non-green bonds (that is, the spread differential is negligibly close to zero) under ordinary market conditions. However, in periods of significant risk-off sentiment, a comparison of secondary spread developments indicates that green bonds offer greater resilience compared to non-green bonds. There are several potential reasons for this.

First, issuers of green bonds have historically been large, stable and forward-looking entities, with established governance structures. These entities are possibly better equipped to withstand a crisis, regardless of their “greenness.”  Secondly, green bonds are rarely issued by oil companies, which were the ones hit hard in both of the last two crises. Thirdly, green bond investors have historically included a large share of long-term investors, such as pension funds and insurance companies, which are unlikely to move from green investments in a crisis (they are sometimes referred to as “hold-to-maturity” investors). In addition, dedicated green bond funds provide additional demand that, all-things-equal, should provide a better cushion for sell-offs.

The combination of long-term and stable issuers, the automatic exclusion of non-green companies hit hardest in past crises, as well the characteristics of green investors, could help explain why green bonds have fared better than traditional bonds during major risk-off periods.


About the authors:

Ebba Ramel is an analyst in Nordea’s Sustainable Bonds team.

Jacob Michaelsen is Head of Sustainable Finance Advisory at Nordea.


Nordea Sustainable Finance Advisory

Nordea's Sustainable Finance Advisory team helps clients navigate fundamental changes in the financial markets as the global economy shifts towards becoming sustainable and low-carbon. Find out more about our sustainable product offerings and holistic advisory services.

Learn more